
TL;DR:
- A healthy SaaS LTV to CAC ratio is around 3:1, but context matters.
- Accurate calculation of LTV and CAC is crucial for meaningful insights.
- Over-optimizing this ratio can hinder growth by causing overly conservative decisions.
Most SaaS founders know the LTV to CAC ratio matters. Fewer understand what actually makes it healthy. The common assumption is simple: a higher ratio is always better. In reality, obsessing over a sky-high ratio can signal that you are leaving serious growth on the table, while a ratio that looks acceptable on the surface can mask deep structural problems. Getting this metric right is not about hitting a magic number. It is about understanding what the number is telling you, calculating it correctly, and acting on it intelligently. This article gives you the tools to do exactly that.
Table of Contents
- What is a good LTV to CAC ratio for SaaS?
- How to calculate LTV and CAC accurately
- Beyond averages: segment and benchmark your ratio
- How to improve your SaaS LTV to CAC ratio
- Why chasing the perfect LTV to CAC ratio can hurt SaaS growth
- Scale your SaaS with actionable, data-driven strategy
- Frequently asked questions
Key Takeaways
| Point | Details |
|---|---|
| Aim for a 3:1 ratio | A healthy SaaS business typically maintains an LTV to CAC ratio of at least 3:1 for sustained growth. |
| Calculate with precision | Accurate formulas using all costs and realistic churn data are essential to avoid major missteps. |
| Segment your metrics | Analyse ratios by channel and customer type, not just overall, to reveal key opportunities and risks. |
| Focus on improvement levers | Reducing CAC and increasing LTV—especially via retention and upsells—moves the needle on sustainable growth. |
| Rely on ongoing review | Update your metrics regularly using mature cohort data and be willing to shift strategies for long-term success. |
What is a good LTV to CAC ratio for SaaS?
Let us start with definitions, because precision matters here. LTV, or customer lifetime value, is the total net revenue you expect to generate from a single customer over the entire duration of their relationship with your product. CAC, or customer acquisition cost, is the total spend required to win that customer in the first place. The LTV to CAC ratio simply compares these two numbers.
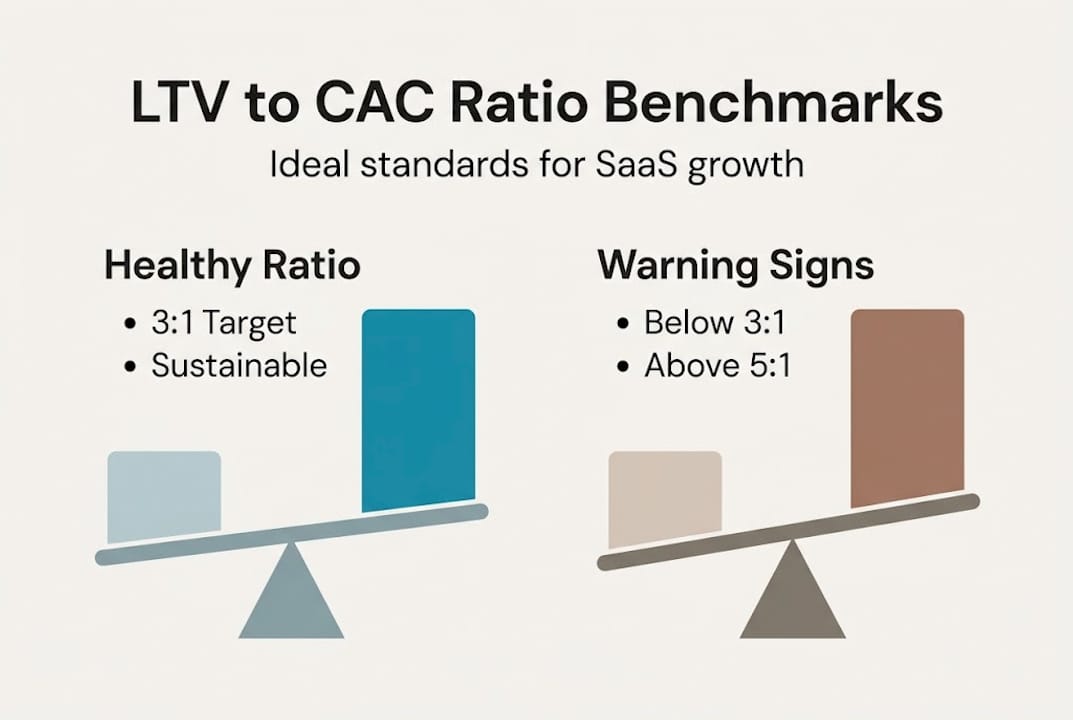
The 3:1 benchmark for SaaS is widely accepted as the standard for sustainable growth. In plain terms, for every pound you spend acquiring a customer, you should expect to generate at least three pounds in lifetime value. This leaves room to cover operating costs, invest in product development, and still generate meaningful profit.
Here is what that looks like with real numbers:
| Scenario | LTV | CAC | Ratio | Signal |
|---|---|---|---|---|
| Healthy SaaS | £3,000 | £1,000 | 3:1 | Sustainable growth |
| Strong performer | £5,000 | £1,000 | 5:1 | Efficient, but check growth spend |
| Under pressure | £2,000 | £1,000 | 2:1 | Needs urgent attention |
| Early-stage risk | £1,200 | £1,000 | 1.2:1 | Burning cash fast |
The table makes the risk visible. A 2:1 ratio is not just “below benchmark.” It means your acquisition spend is barely covered by the value you generate, leaving almost nothing for overheads, product, or profit.
“A high LTV to CAC ratio above 5:1 is not always a sign of health. It can mean you are being too conservative with growth spend, missing opportunities to acquire customers you could profitably serve.”
This is the insight most founders miss. A ratio above 5:1 often signals under-investment in sales and marketing rather than exceptional efficiency. If you are sitting at 7:1 or 8:1, the question is not “how do we maintain this?” but “why are we not deploying more capital to grow faster?”
Conversely, a ratio below 3:1 is a clear warning. Either your acquisition costs are too high, your customers are not staying long enough, or both. Neither problem fixes itself. Understanding your lead to close rate benchmarks alongside LTV to CAC gives you a fuller picture of where the inefficiency is entering your funnel.
The benchmark also shifts with context. Enterprise SaaS with long sales cycles and high ACV (annual contract value) may tolerate a lower ratio temporarily because the absolute LTV is enormous. Conversely, a high-volume SMB SaaS product with low ACV needs a tighter ratio to remain viable. The 3:1 rule is a starting point, not a universal law.
How to calculate LTV and CAC accurately
Knowing the right benchmarks is only useful if your calculations are accurate. Let us break down how to do the maths correctly, with no nasty surprises later.
Calculating LTV
The core formula is:
LTV = (ARPU × Gross Margin) / Churn Rate
Where ARPU is average revenue per user per month. Gross margin accounts for the cost of delivering your service. Churn rate is the percentage of customers who cancel each month.

For example, if your ARPU is £200, gross margin is 75%, and monthly churn is 2.5%, your LTV is:
(£200 × 0.75) / 0.025 = £6,000
A more accurate LTV calculation uses cohort data from the trailing 6 to 12 months and includes expansion revenue from upsells and cross-sells. Ignoring expansion revenue consistently understates LTV, sometimes by 20 to 30%.
Calculating CAC
The formula is:
CAC = Total Sales and Marketing Spend / New Customers Acquired
This sounds straightforward. It rarely is. A fully loaded CAC calculation includes salaries, commissions, advertising spend, software tools, agency fees, and any overhead attributable to acquisition. Both figures must cover the same time period.
Here is a simple example for a SaaS business in a given quarter:
| Cost category | Amount |
|---|---|
| Paid advertising | £18,000 |
| Sales team salaries | £24,000 |
| Marketing tools and software | £4,000 |
| Agency and contractor fees | £6,000 |
| Total spend | £52,000 |
| New customers acquired | 52 |
| CAC | £1,000 |
Common calculation errors to avoid
- Excluding salaries and tools from CAC, which leads to a figure that is 40 to 60% lower than the true cost
- Using optimistic churn assumptions rather than actual cohort data
- Failing to apply gross margin to LTV, which inflates the figure significantly
- Mixing time periods, for example using last year’s CAC against this quarter’s LTV
- Ignoring the lag between spend and acquisition, particularly in long sales cycle businesses
Pro Tip: Cross-verify every input in your LTV and CAC calculations against your accounting software, CRM, and payroll data. It is common to find discrepancies of 15 to 25% between what teams report and what the finance data actually shows. That gap distorts every decision downstream.
Accurate numbers are the foundation. Strategies built on flawed inputs will consistently disappoint. Investing time to reduce acquisition costs through better channel selection only works when you know your true CAC to begin with.
Beyond averages: segment and benchmark your ratio
Once your numbers are accurate, getting smarter means looking closer. Here is how segmentation transforms your growth strategy.
A blended LTV to CAC ratio tells you the average across your entire business. It is useful as a headline figure. But it hides as much as it reveals. Consider a SaaS business with a blended ratio of 3.5:1. That looks healthy. But beneath the surface, the enterprise segment might be running at 6:1 while the SMB segment is at 1.8:1. The enterprise performance is subsidising a segment that is actively destroying value.
Segmenting by stage, ACV, and channel is essential to avoid this trap. Organic acquisition might be delivering a 7:1 ratio while paid social is running at 2:1. Without segmentation, you would never know that paid social is dragging down your overall performance.
Practical segmentation approaches
- By customer segment: Enterprise vs. mid-market vs. SMB. Each has different CAC, churn, and expansion patterns.
- By acquisition channel: Organic search, paid search, paid social, referral, outbound. Each channel has a distinct cost profile and customer quality.
- By product tier: Starter, Growth, and Enterprise plans often attract customers with very different LTV profiles.
- By geography: International markets may have lower CAC but also lower ARPU and higher churn.
- By cohort: Customers acquired in different periods behave differently, especially if your product or onboarding has changed.
The practical output of this analysis is a prioritisation framework. You direct more budget toward the channels and segments with the strongest ratios. You fix or exit the ones that are structurally unprofitable.
Pro Tip: Always monitor both your blended ratio and your granular segment ratios side by side. The blended figure is what you report to investors. The segment figures are what you use to make decisions. If they diverge significantly, you have a strategic problem worth investigating immediately.
Strong SaaS marketing analytics capability is what makes this level of segmentation possible at scale. Without clean, consistent data across your funnel, you are making decisions based on incomplete information. Segmentation also directly informs how you increase SaaS MRR, because it shows you exactly which customers and channels drive the most durable revenue.
How to improve your SaaS LTV to CAC ratio
Dissecting your numbers will expose weaknesses and strengths. Here is what you can actually do to shift your ratio in the right direction.
There are two levers: reduce CAC or increase LTV. Most businesses need to work both simultaneously, but the right emphasis depends on where your ratio is breaking down.
Reducing CAC
- Audit every acquisition channel for true cost per customer, not just cost per lead
- Invest in content and SEO to build organic acquisition that compounds over time
- Implement referral and partner programmes that leverage your existing customers
- Automate repetitive top-of-funnel tasks to reduce sales team overhead
- Tighten your ideal customer profile (ICP) so sales cycles shorten and conversion rates improve
Increasing LTV
- Improve onboarding so customers reach their first value milestone faster, reducing early churn
- Build upsell and cross-sell triggers directly into the product experience
- Introduce annual billing options with incentives to reduce monthly churn risk
- Create customer success programmes for your highest-value segments
- Monitor and act on leading indicators of churn, such as declining usage or support ticket volume
The macro environment matters too. CAC has risen approximately 14% year on year across SaaS, driven by increased competition, rising ad costs, and longer enterprise sales cycles. This means efficiency improvements are no longer optional. Product-led growth (PLG) strategies, where the product itself drives acquisition and expansion, are becoming a structural advantage for companies that can execute them well.
On the LTV calculation side, use cohort data of at least 12 months and cap your assumed customer lifetime at four to seven years. This is especially important for low-churn SaaS products where a pure formula would produce an unrealistically high LTV figure. Capping the lifetime keeps your planning grounded in reality.
Improving the ratio is not a one-time project. It requires a continuous feedback loop between your acquisition strategy, product experience, and retention efforts. Mapping and refining how you optimise the SaaS customer journey is one of the most direct ways to lift LTV without increasing acquisition spend. And when you do invest more in acquisition, having a clear framework to boost SaaS ROI ensures that spend is working as hard as possible.
Why chasing the perfect LTV to CAC ratio can hurt SaaS growth
We work with SaaS founders who have optimised their LTV to CAC ratio to impressive levels and then wondered why growth had stalled. The ratio looked excellent. The business was not moving.
The uncomfortable truth is that the LTV to CAC ratio is a lagging indicator. It tells you how past decisions have performed. It does not tell you whether your current strategy is positioning you for the next phase of growth. Founders who treat it as a real-time compass end up making overly conservative decisions at exactly the moment when bold investment would create a step-change in market position.
At the early stage, a ratio below 3:1 can be entirely rational if you are buying market share in a category you intend to dominate. At the growth stage, a ratio above 5:1 might mean you are under-investing in the sales capacity needed to scale. Context determines what the number should be.
The best SaaS companies we have seen build a data-driven digital marketing plan that treats LTV to CAC as one signal among many, not the sole arbiter of every decision. They balance it against payback period, net revenue retention, and market share trajectory. They revisit their assumptions quarterly as the competitive landscape shifts. That is what separates the businesses that scale intelligently from those that optimise themselves into a corner.
Scale your SaaS with actionable, data-driven strategy
At Media House Agency, we work directly with SaaS founders and growth executives to turn metrics like LTV to CAC into clear, executable strategy. We bring the same analytical precision used by leading SaaS businesses to your acquisition, retention, and revenue expansion efforts. Whether you need to sharpen your SaaS marketing strategies, follow a proven SaaS conversions guide to lift your close rates, or optimise your SaaS workflow for greater efficiency, we build the frameworks that make growth measurable and repeatable. If you are ready to move beyond guesswork and build a ratio that reflects genuine business health, let us talk.
Frequently asked questions
What is considered a ‘bad’ LTV to CAC ratio for SaaS?
A ratio below 3:1 is generally considered unsustainable, as the standard SaaS benchmark requires lifetime value to be at least three times the acquisition cost to support healthy growth. Anything lower signals that CAC needs cutting or LTV needs lifting as a priority.
Should early-stage SaaS aim for the classic 3:1 ratio?
Early-stage SaaS can temporarily run below 3:1 if aggressive growth and investor backing justify the burn, but the target should be 3:1 or better as the business matures. A ratio above 5:1 at any stage may indicate missed growth opportunities rather than exceptional performance.
How often should SaaS companies recalculate their LTV to CAC ratio?
Quarterly recalculation using updated cohort and financial data is best practice, ensuring your strategies stay aligned with market and product changes.
What costs are often missed in CAC calculations?
Salaries and marketing software are the most commonly excluded items, resulting in a CAC that is 40 to 60% lower than the true fully loaded figure, which distorts every growth decision that follows.
Why use cohort data and a limited lifetime for LTV?
Mature cohort data of 12+ months combined with a capped customer lifetime of four to seven years produces realistic LTV estimates, preventing artificially inflated figures that lead to over-optimistic planning, particularly in low-churn SaaS businesses.